 Pyramids of Giza Tours
Egypt month by month: weather and travel search data
The average weather in Cairo, Luxor and Aswan for each month, next to the number of people in the United States who searched Google for the best time to visit Egypt.
Last checked · Weather: WMO World Weather Information Service · Searches: DataForSEO
Key statistics
Each button copies the sentence and a source line with a link to this page.
The average daily high in Cairo is 30 °C (86 °F) or less in every month from October to April (1981 to 2010 averages).
January is the coolest month in Cairo, with an average daily high of 19.0 °C (66 °F).
In July, the hottest month in Luxor, the average daily high there is 41.4 °C (107 °F).
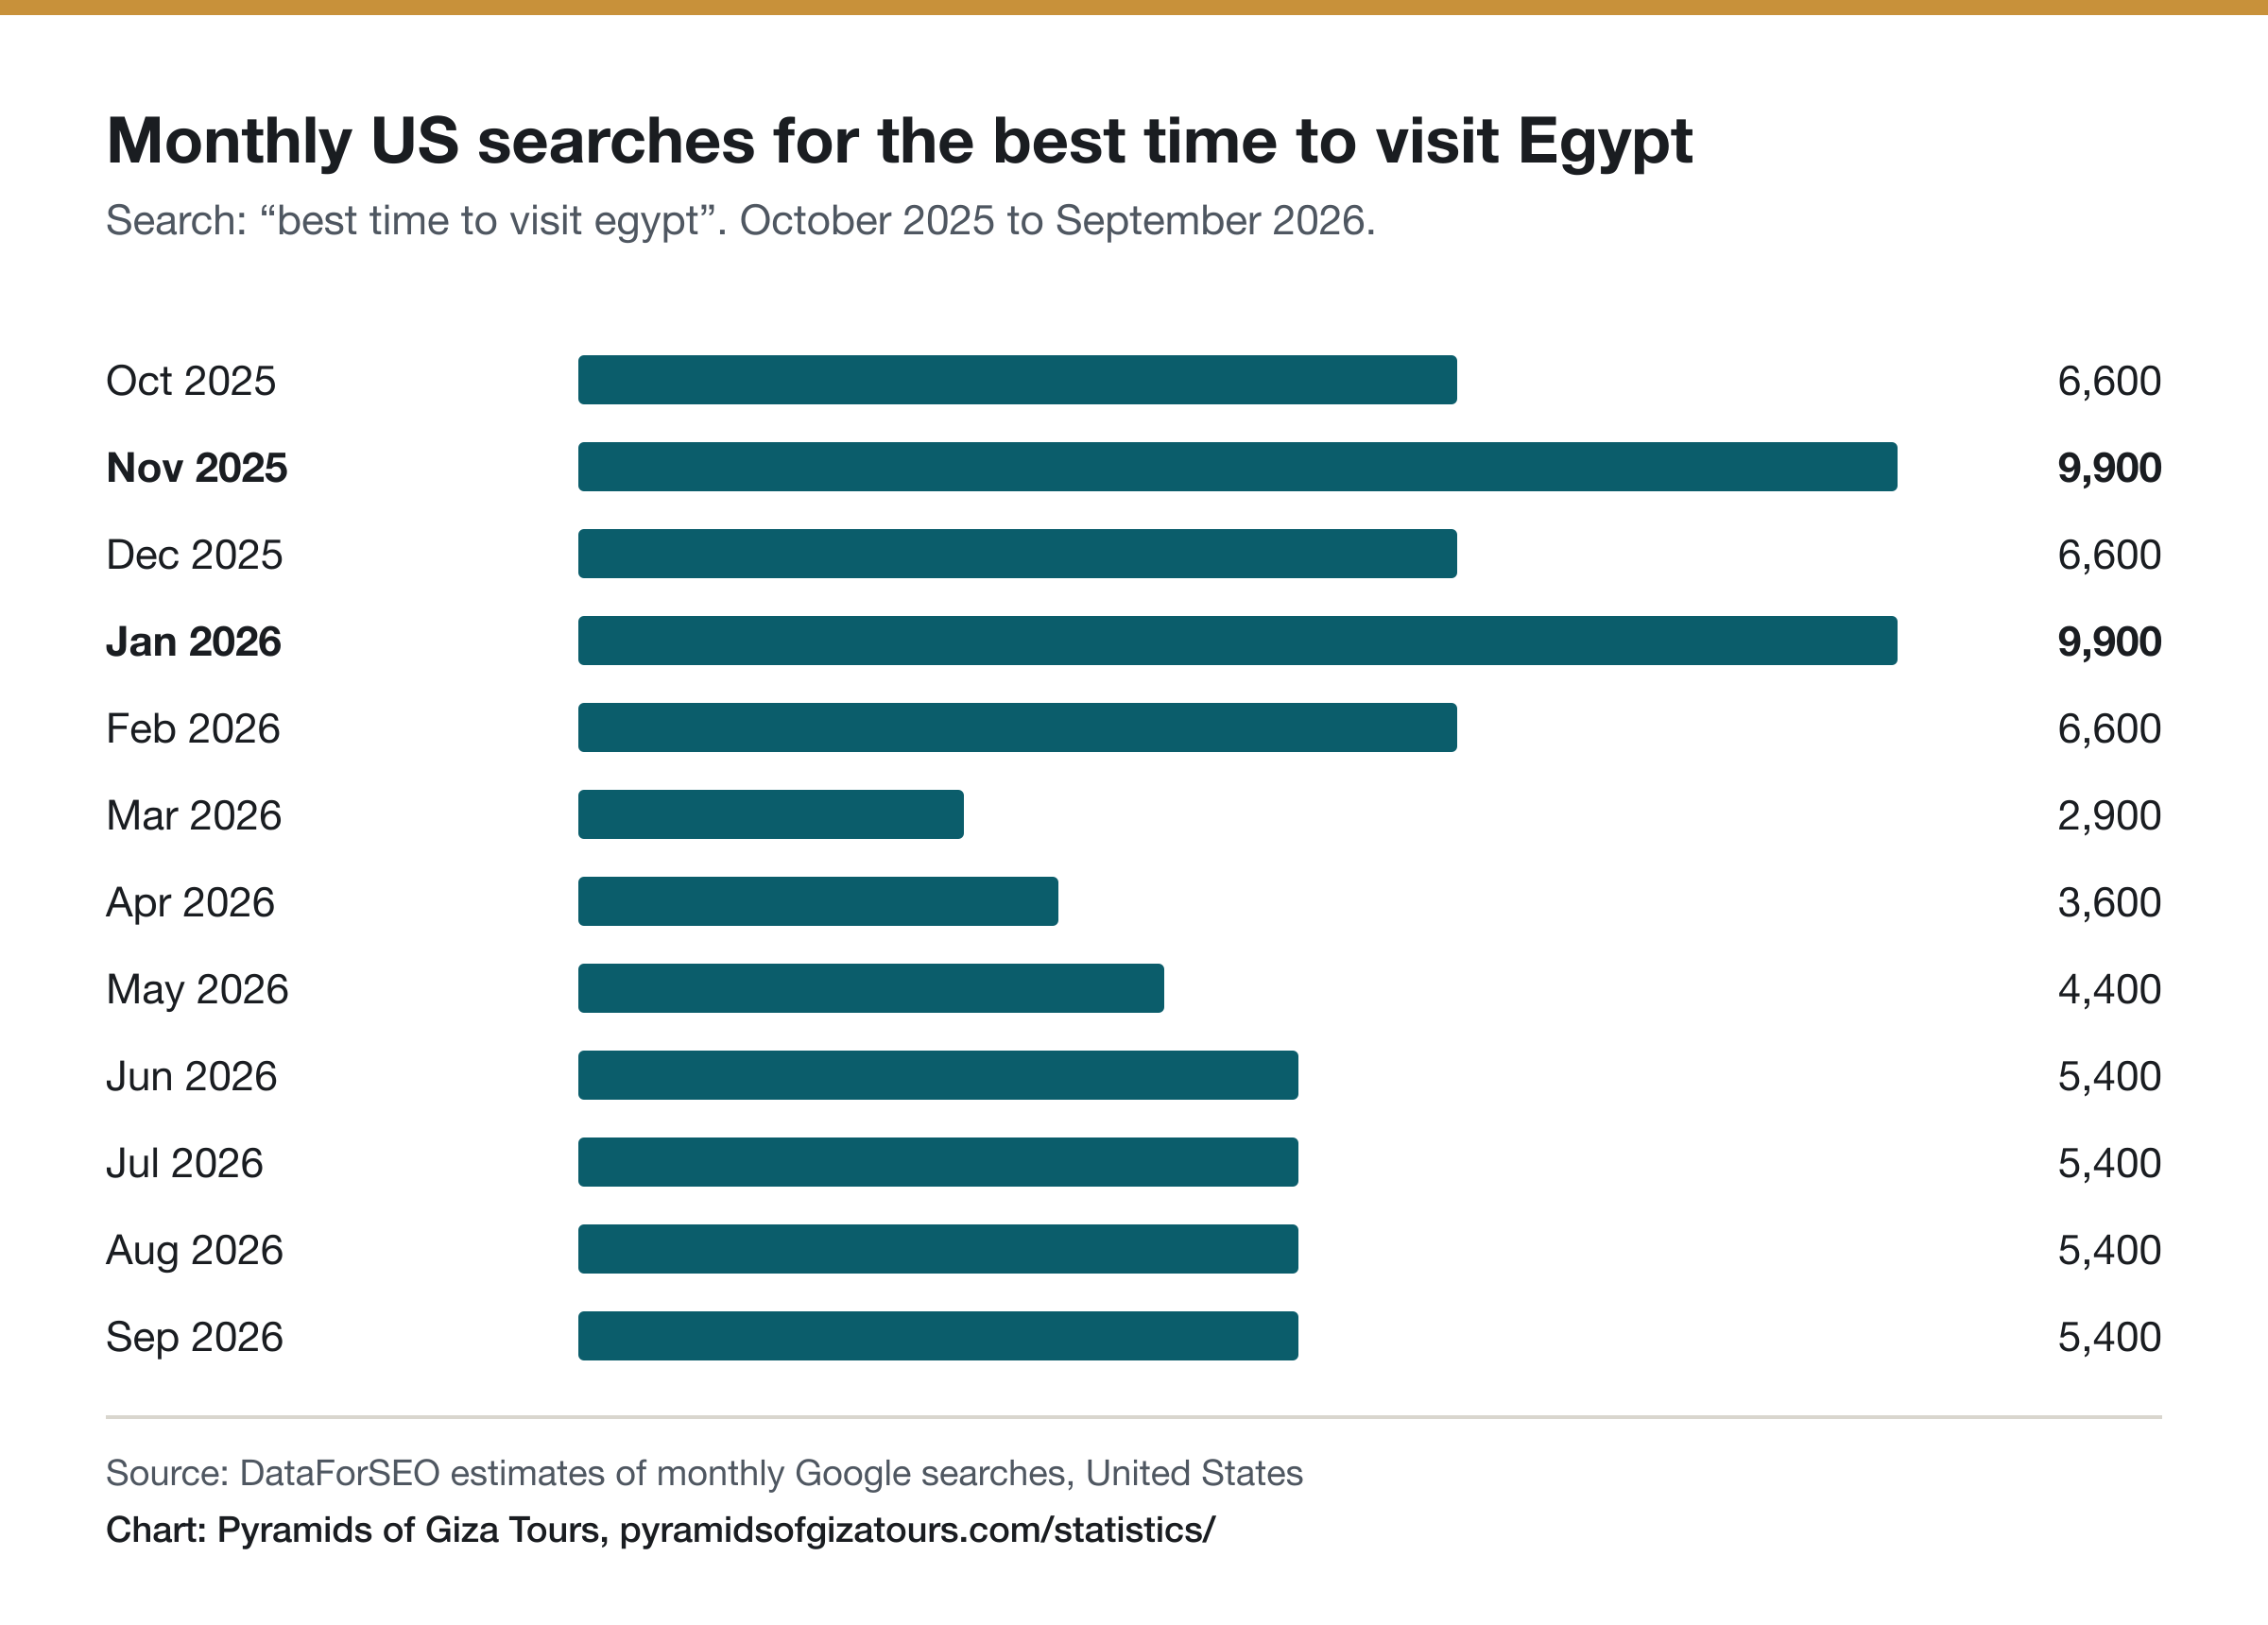
US Google searches for "best time to visit egypt" were highest in January and November (9,900 a month) and lowest in March (2,900).
In the peak search months, the average high in Cairo is 19.0 °C and 24.7 °C. In March, it is 23.4 °C.
Month by month
Temperatures are averages of the daily high and the daily low for 1981 to 2010. Searches are for the same calendar month between October 2025 and September 2026.
| Month | Cairo and Giza | Luxor | Aswan | US searches | Note |
|---|---|---|---|---|---|
| January | 19.0 / 9.7 | 23.0 / 5.9 | 22.9 / 8.8 | 9,900 | Coptic Christmas, 7 January, is a public holiday. Office Holidays |
| February | 20.3 / 10.3 | 25.1 / 7.8 | 24.8 / 11.0 | 6,600 | Ramadan 2027 is expected to start on about 8 February. Some sites have shorter hours. Gulf News |
| March | 23.4 / 12.3 | 29.5 / 11.8 | 29.4 / 14.9 | 2,900 | Eid al-Fitr holiday expected 9 to 11 March 2027. Many Egyptians travel at this time. Office Holidays |
| April | 28.2 / 15.4 | 35.3 / 16.9 | 35.2 / 19.9 | 3,600 | Khamsin: hot, dusty winds from the south can blow from March to May, most often in April. Wikipedia |
| May | 31.9 / 18.4 | 39.0 / 21.2 | 39.0 / 23.1 | 4,400 | Eid al-Adha holiday expected 15 to 19 May 2027. Office Holidays |
| June | 34.6 / 21.4 | 41.3 / 23.5 | 41.2 / 26.1 | 5,400 | — |
| July | 34.8 / 22.9 | 41.4 / 24.7 | 41.4 / 26.2 | 5,400 | — |
| August | 34.5 / 23.3 | 41.0 / 24.4 | 41.2 / 26.0 | 5,400 | — |
| September | 33.1 / 21.7 | 39.3 / 22.2 | 39.5 / 25.0 | 5,400 | — |
| October | 29.7 / 19.0 | 35.3 / 18.4 | 35.7 / 20.8 | 6,600 | — |
| November | 24.7 / 14.6 | 29.0 / 12.3 | 29.0 / 15.6 | 9,900 | — |
| December | 20.4 / 11.0 | 24.3 / 7.8 | 24.2 / 11.3 | 6,600 | — |
Weather
Luxor and Aswan are in the south. Their days are warmer than in Cairo all year, but their January nights are colder.
Source: WMO World Weather Information Service, data from the Egyptian Meteorological Authority. Chart: pyramidsofgizatours.com/statistics/egypt-month-by-month/
Source: WMO World Weather Information Service, data from the Egyptian Meteorological Authority. Chart: pyramidsofgizatours.com/statistics/egypt-month-by-month/
Source: WMO World Weather Information Service, data from the Egyptian Meteorological Authority. Chart: pyramidsofgizatours.com/statistics/egypt-month-by-month/
Trip planning searches
This chart uses the same search data as our statistics page.
Source: DataForSEO estimates of monthly Google searches, United States. Chart: Pyramids of Giza Tours, pyramidsofgizatours.com/statistics/
Method and limits
- The weather is the 1981 to 2010 average from the WMO World Weather Information Service. The Egyptian Meteorological Authority supplies the data. A given year can be hotter or colder.
- The Cairo station is at Cairo Airport, approximately 30 km from the pyramids. Giza can be slightly different.
- The searches are DataForSEO estimates for searches in English from the United States. They are not visitor numbers.
- We found no public monthly data for visitor numbers or hotel prices in Egypt. So the table has no crowd or price column.
- Islamic holidays move about 11 days earlier each year. The dates in the notes are expected dates for 2027.
Use this data
You can use this table and these charts in your article. Name Pyramids of Giza Tours as the source and link to this page.